Email Open Rate Explained (and What Yours Is Telling You)
Knock on 100 doors. Count who answers. That's your open rate, and here's the story it's telling you.
8 min read
What the actual f*** is an open rate? That's probably what you're wondering if you're new to email, or new to newsletters. And I'm going to break it down for you, but not in the elementary "this is what an open rate is, this is what it means" way. Instead, I'm going to help you find your open rate, understand what it means without feeling overwhelmed, and know the story that it's telling you.
This is Episode 2 of WTF Is a Newsletter?, my free four-week series. If you'd rather watch than read, here's the whole episode:
Last week, I helped you understand exactly what a newsletter is, and how you can use it at your business to better connect with your customers. If you missed that episode, you can go back and watch it.
As a reminder, every episode in this series comes with a free worksheet. To get it, all you have to do is put in your email at actuallyfunemail.com/wtf, and I will email the worksheet directly to you. Got it? Got it. Good. Well, actually, I'll email you the worksheet for the first episode, and then the second, and then the third. You get it. You get it. You get it. You're going to get the worksheet for this episode.
Free 4-week series
WTF Is a Newsletter?
Free for four weeks, 15 minutes a week, until writing your newsletter actually feels easy.
New episode every Thursday.
So, without further ado, go ahead and open your email tool, whether it's Kit, beehiiv, Substack, whatever. Open it up, because you're going to want it handy while we decode what an open rate actually is.
Knock on 100 doors
So to put it in layman's terms: if you went down the street and knocked on 100 doors, an open rate is how many out of that 100 open. If 50 out of 100 open, that would be a 50% open rate. Make sense? It's a statistic that shows you how many people open your emails and read them. More or less.

You don't need any special formula to do the math on this. Your email tool is already doing it for you behind the scenes. So just look at the number, say, "All right, that's the number," and keep it pushing.
But if you're a math nerd and you really want to know, the formula is the number of people who opened divided by the number of people you sent it to. Move the decimal over, and that's how you get the percentage. Got it? That's the secret open rate formula.
They put it in a percentage because whether you have 100 people on your list or 100,000 people on your list, it means the exact same thing.
Where to find yours
Here's the easy way to find it in two quick minutes. You can go to your overview dashboard to see something like the last 30 days of your open rate. Or you can go into a single broadcast or post and see your open rate there. These are the two views where you're going to be able to see your open rate in almost any email service provider or email tool.

This is the perfect time to pause and go see what your open rate is before we continue on.
Your homework: last week, last month, last year
Continuing on, and diving into the worksheet a little bit: if you've had a newsletter for a while, your homework for this episode is to go and write down what your open rate is for last week, for last month, and for the last year.
The reason I want you to write down these three statistics is not because one is better than the other, but because combined, they tell a story.

Sometimes, an email doesn't land. It could be a bad subject line. It could be a bad time that you sent it. It's hard to tell exactly what it is without really digging into the patterns of your email. But when you zoom out and look at a month and a year, you can start to see trends in your open rates.
A spike up
If you're looking at a graph of the last year of your email sends and you see one big spike up, and then it goes back flat, it means that you either had a really great subject line or there was a really strong reason for people to open. It could be a sales window. Maybe you were selling something during Black Friday and people were more interested in buying. Or it could have been literally anything. You have to use a few context clues to figure out exactly what happened there, but it's information you need to know to figure out if it was a fluke or something that's repeatable.
A spike down
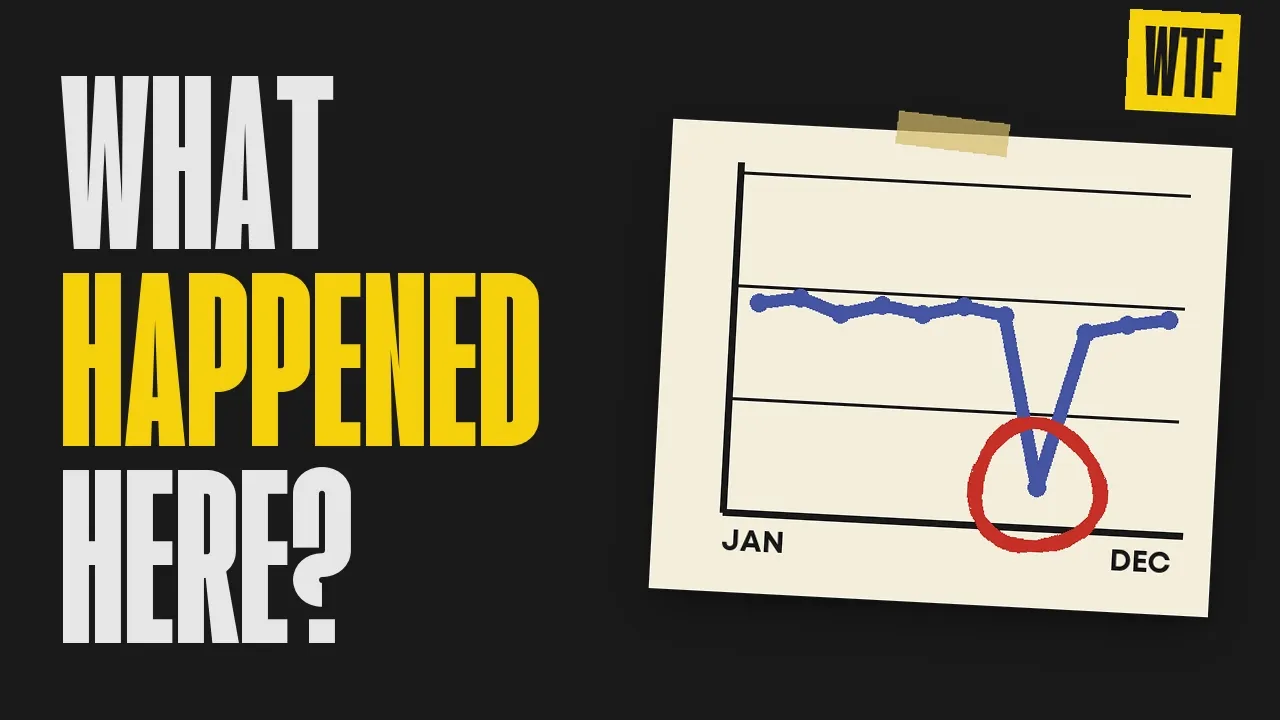
If you see the opposite, one flat line with a big spike down, and then it comes back up to a flat line, that's probably telling you that email was not delivered well, and for some reason it ended up in a lot of spam folders. That is something you also need to look at. Maybe you sent it out to the wrong list. Maybe you used a short link.
I know for me personally, at one point, YouTube changed the way they did links to YouTube videos. I would put a YouTube video into my email, and then it would get sent straight to spam and marked as unsafe for external users. It was never an unsafe email. Google just started flagging it as spam for some reason. So I had to go through and painstakingly figure out which link was causing it, by removing one and sending a test, and removing one and sending a test.
Hopefully, you don't have that. But if you have it and it's returned to flat, I would see what the outlier was. It could have also been a subject line. Most likely, you're not going to experience one strong dip. That information is important, though, if you see it.
A flat line
If your line is flat across the board, it means that your open rate is staying steady. People are resonating with your subject lines, and they're coming back time and time again to review your content. It's not a bad thing to see a flat line when it comes to a year of open rates.

Some email apps lie
One important piece of information that you need to know about open rates when you're looking at them is that some email apps lie about whether they opened or didn't open. So when you see that your open rate is high, it could potentially mean that email apps are automatically opening those emails before a reader ever does. If you see it low, it means that even email apps aren't opening them. They're probably ending up in spam. Those are really what the highs and lows of those peaks mean.

Watch the trend
And that's also why it's really important to watch the trend. If your open rate is trending up across a year, that means more people are joining your list, more people are engaging, more people are finding value to come back. If it's trending down, it means that less people are reading your emails, less people are likely to see them, and more people are probably reading an email and getting turned off by something that's being said in there. If it zigzags, that means something you're doing is triggering spam.
Find your base rate
The important part about trend watching for your email list is that it helps you understand what your base rate is. Because for one client, I have a base open rate of 40%. And for another client, I have a base open rate of 60%. So for that client, I know, hey, when it's under 60%, it's underperforming. And for this client, I know when it's over 40%, it's overperforming in terms of open rates.

You can't compare against other people, because the way that opens work, it skews the balance a little bit, right? So try not to use other people's open rates as a comparison metric. Instead, look at your personal trends for the last year, for the last month, the last six months, for a lesson in what is working and what's average for your account.
Next week, we're going to talk a little bit more about a number that's harder for email apps to fake: clicks. But for now, let's focus in on opens.
Find your most-opened email
So what I would really love for you to do on the homework and the worksheet this week is go through and find your most-opened email ever. That's probably going to translate to your strongest ever subject lines. If you have a few emails that are really close, like a 41 and a 41.5, just write down those subject lines.
When you find emails that perform above your open rate average, and not just a few points above, but well above, so maybe five or 10 points above your open rate average, just jot that subject line down. That's information that people are most likely seeing before they choose to open the email, right? So we want to know as much information as we can. And we want to start seeing if there's something connected between those subject lines. Is there a format that really works well for your audience? Is there a call to action in the subject lines that's really compelling? Those are all things that we're looking for when we're looking at open rates to determine what's working well.
A few tricks to get more opens
Here are a few tricks to get more opens along the way.
Check and play with the time you send your email. If you're sending on Sunday, people are probably not waking up super early, so maybe don't send an email super early on Sundays. See when your readers are around, and then start planning and staying consistent with the time that you send. I have one client who always sends his newsletters at 7pm. I send them five minutes before or five minutes after seven, and it works like clockwork. When we send outside of that window, his readers are less likely to open, because they're not on their phones.
If you are stuck writing a subject line, text the subject line to your friend. If you were about to send the newsletter to your friend, text them a quick five to seven word summary and see what would happen. Would it still sound like you?
There is a little button inside of Kit, and inside of every email provider, called the preview line. You're going to want to put about a sentence or two in there to summarize what the email's about. You can think of it as your second subject line: the thing that gets shown to some readers beforehand. I say some because now AI summarizes emails. So depending on who's getting your email, and how long it's sat in their inbox, AI might be summarizing the email instead of letting them read a preview text that you've written. But that doesn't mean that preview text doesn't count towards the AI summary.
The number one most important thing you can do to continually improve your open rate is to send the same day, the same time, every time. Got it?
Before next week
Now, before next week, be sure to grab that worksheet if you haven't already. It's at actuallyfunemail.com/wtf. Fill out exactly what your open rate is. It's going to ask you some easy questions to help orient you inside of your email tool, and help you start to understand what is actually happening behind the scenes of an open rate, and what is really going through subscribers' minds when they see your emails, so that you're more likely to get better results from the emails that you're spending your time writing.
Open rates tell you exactly who looked. And next week, we're going to dive into who's actually engaging and reading the emails. We're going to talk about click rate.
Peace and love. Have fun.
Dopamail is a method I created at Actually Fun Email. New here? Start with Dopamail.
Want the rest of the series in your inbox? Sign up below and I'll send each episode, plus the worksheet that goes with it, every Thursday.
Free 4-week series
Cross the newsletter off for good.
New episode every Thursday.
The newsletter
Get more of this, weekly-ish.
Short. Free. No fluff.